HealthSnap ingested over 53 million data points in 2024. This volume presents a unique opportunity to advance the understanding of lesser-known but potentially important predictors of health that, until now, have required larger datasets to realize their potential. One such example is Blood Pressure Variability (BPV), the fluctuation in blood pressure over time. While the dangers of sustained high blood pressure (hypertension) are well-documented, BPV has been shown to independently predict cardiovascular risks, including stroke and heart attack. As with all medical care, more information enables more informed decision-making. Remote patient monitoring (RPM) represents an opportunity to collect and analyze BPV data, leveraging a data-driven approach to improve the quality of care and patient outcomes.
The Value of Blood Pressure Variability
BPV has been studied across different timeframes, ranging from short-term fluctuations within 24 hours to long-term variability over months or years. Studies have demonstrated that BPV is independently predictive of cardiovascular events, such as stroke, coronary artery disease, and mortality.
- Short-term BPV: The International Database on Ambulatory Blood Pressure Monitoring in Relation to Cardiovascular Outcomes (IDACO) study demonstrated that 24-hour systolic BPV significantly predicts stroke risk, independent of mean BP levels (Hansen et al., 2010).
- Long-term BPV: Visit-to-visit variability in BP over months or years has been linked to higher risks of stroke and cardiovascular mortality, as shown in studies like the Anglo-Scandinavian Cardiac Outcomes Trial (ASCOT) and the ALLHAT trial (Rothwell et al., 2010; Mehlum et al., 2018).
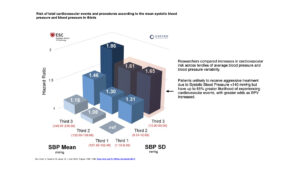
A long-term follow-up to the ASCOT study, which included 20 years of patient data, provided groundbreaking insights into the prognostic value of BPV. In this longitudinal study, over half of cardiovascular events occurred in individuals with systolic blood pressure (SBP) below the commonly accepted threshold of 140 mmHg. These events were best predicted by in-office BPV measured across the study duration, rather than mean SBP alone. This finding underscores the importance of monitoring BP fluctuations over time to improve risk stratification and guide clinical interventions.
Long-term studies traditionally rely on office visit measurements at time increments of 3–6 months. One evaluation method for BPV is to use the standard deviation (SD) from multiple clinic blood pressure measurements. Elevated SD values exceeding 12 mmHg have been associated with a significantly higher risk of cardiovascular events (Lai et al., 2024). The Valsartan Antihypertensive Long-term Use Evaluation trial demonstrated that a 5 mmHg increase in the standard deviation of blood pressure values corresponded to a 10% increase in mortality (Mehlum et al., 2018). Similarly, a large Chinese study of ~65,000 patients comparing two time points over an average follow-up of 10 years reinforced the association between BPV and cardiovascular incidence, even suggesting that this measure may be more predictive in men (Wu et al., 2023).
Patients enrolled in remote patient monitoring programs are accustomed to taking daily measurements, providing roughly 100 times more data points compared to the aforementioned studies.
Recent Advances in BPV Research
Recent studies have further solidified BPV’s role as an independent cardiovascular risk factor. Researchers in Japan developed a cardiovascular risk prediction score incorporating home-derived daily BP variability over the course of a week, demonstrating its value in improving accuracy over mean BP alone (Kikuya et al., 2024). Additionally, a 2023 position paper published in the Journal of Hypertension by the European Society of Hypertension offered comprehensive guidance on data collection and risk stratification for researchers and clinicians.
To fully integrate BPV into clinical practice, researchers and clinicians must address several key considerations:
- Impact of Antihypertensive Medications on BPV: Treatment of hypertension may soon focus on reducing both BP levels and BPV. Research shows that calcium channel blockers (CCBs) are more effective than other classes, such as diuretics and beta-blockers, in reducing BPV (Rothwell et al., 2010; Muntner et al., 2014).
- Measurement Protocols: Researchers are investigating the optimal measurement frequency, timing, and the inclusion of nocturnal versus daytime readings to enhance the clinical relevance of BPV data.
- Defining Thresholds for High BPV: Ongoing studies aim to determine which statistical representations of variability are most predictive of outcomes and establish actionable thresholds.
- Mechanisms Linking BPV and Cardiovascular Risk: Fluctuations in BP may increase variability due to disrupted central nervous system regulation, inflammatory cytokines, and oxidative stress (Parati et al., 2013).
- Impact on Other Organ Systems: There is a bidirectional relationship between impaired kidney function and vascular instability. BPV is associated with a 21% higher risk of chronic kidney disease (CKD) progression, comparable to the 20% risk seen with diabetes. A meta-analysis confirmed significant links between BPV, end-stage renal disease, and adverse renal outcomes (Yang et al., 2023).
How RPM Can Unlock BPV’s Potential
RPM allows patients to measure their blood pressure daily using connected devices, offering a wealth of real-world data. By leveraging RPM, clinicians can:
- Improve Risk Stratification: Detect subtle BPV patterns to enhance predictions beyond mean BP values.
- Enable Proactive Interventions: Use evidence-based alerts to identify early warning signs and prompt timely action.
- Link Behavioral Factors: Cross-reference BPV data with diet, physical activity, sleep, and stress metrics to understand lifestyle impacts.
- Personalize Treatment: Guide tailored interventions, such as selecting medications that stabilize BP variability.
To understand the potential of RPM for BPV, we can look to successful applications of other dynamic metrics:
- Heart Rate Variability (HRV): HRV is a measure of the variability between heartbeats, providing insights into the autonomic nervous system’s balance. High HRV is associated with cardiovascular resilience, while low HRV signals potential dysfunction. Unlike static heart rate measurements, HRV uncovers critical patterns that reflect underlying health.
- Continuous Glucose Monitoring (CGM): CGM has reshaped diabetes care by introducing metrics such as the percentage of time in range (TIR), which captures glucose stability and fluctuations. These metrics have proven to be more informative than average glucose readings, enabling better glycemic control.
Similarly, BPV—as a dynamic measure—offers a more nuanced understanding of cardiovascular risk compared to static blood pressure values.
At HealthSnap, clinical staff have adapted metrics from continuous glucose monitoring, such as “% Readings In Range,” to help patients recognize and reduce BP fluctuations within 30-day averages. This metric enables patients and their care teams to work collaboratively toward better outcomes.
Conclusion
Leveraging RPM data can enhance risk stratification, personalize treatments, and improve outcomes. Much like CGM has revolutionized diabetes care, RPM has the potential to redefine hypertension management for millions of patients worldwide. BPV is just one example of the promise offered by home-based health monitoring.
To learn more about the HealthSnap RPM solution, please book time with our team here.